

Welding and cutting equipment manufacturer ESAB (NYSE:ESAB) reported Q1 CY2025 results exceeding the market’s revenue expectations, but sales fell by 1.7% year on year to $678.1 million. Its non-GAAP profit of $1.25 per share was 3.6% above analysts’ consensus estimates.
Is now the time to buy ESAB? Find out by accessing our full research report, it’s free.
ESAB (ESAB) Q1 CY2025 Highlights:
- Revenue: $678.1 million vs analyst estimates of $663.7 million (1.7% year-on-year decline, 2.2% beat)
- Adjusted EPS: $1.25 vs analyst estimates of $1.21 (3.6% beat)
- Adjusted EBITDA: $127.9 million vs analyst estimates of $120.9 million (18.9% margin, 5.8% beat)
- Management reiterated its full-year Adjusted EPS guidance of $5.18 at the midpoint
- EBITDA guidance for the full year is $525 million at the midpoint, above analyst estimates of $520.4 million
- Operating Margin: 16.2%, in line with the same quarter last year
- Free Cash Flow Margin: 0%, down from 5.4% in the same quarter last year
- Organic Revenue was flat year on year (2.2% in the same quarter last year)
- Market Capitalization: $7.28 billion
Company Overview
Having played a significant role in the construction of the iconic Sydney Opera House, ESAB (NYSE:ESAB) manufactures and sells welding and cutting equipment for numerous industries.
Sales Growth
A company’s long-term sales performance is one signal of its overall quality. Even a bad business can shine for one or two quarters, but a top-tier one grows for years. Unfortunately, ESAB’s 2.9% annualized revenue growth over the last three years was sluggish. This was below our standards and is a poor baseline for our analysis.
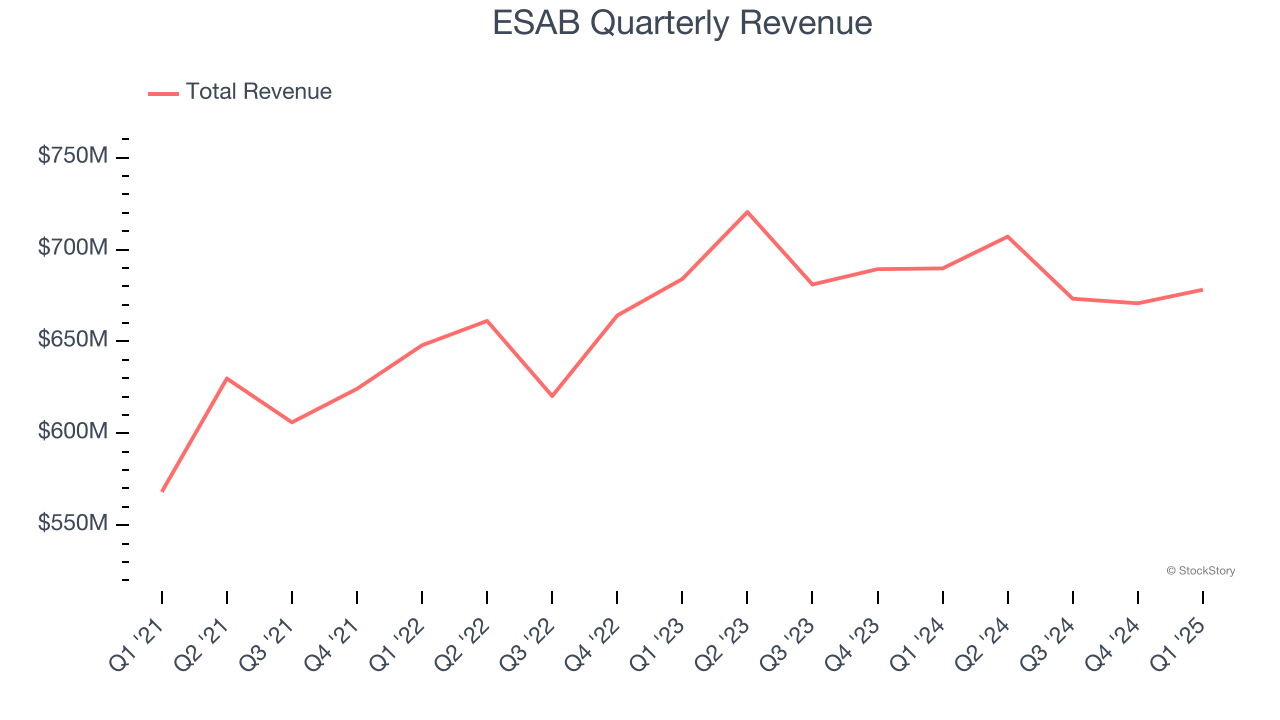
We at StockStory place the most emphasis on long-term growth, but within industrials, a stretched historical view may miss cycles, industry trends, or a company capitalizing on catalysts such as a new contract win or a successful product line. ESAB’s annualized revenue growth of 1.9% over the last two years aligns with its three-year trend, suggesting its demand was consistently weak. 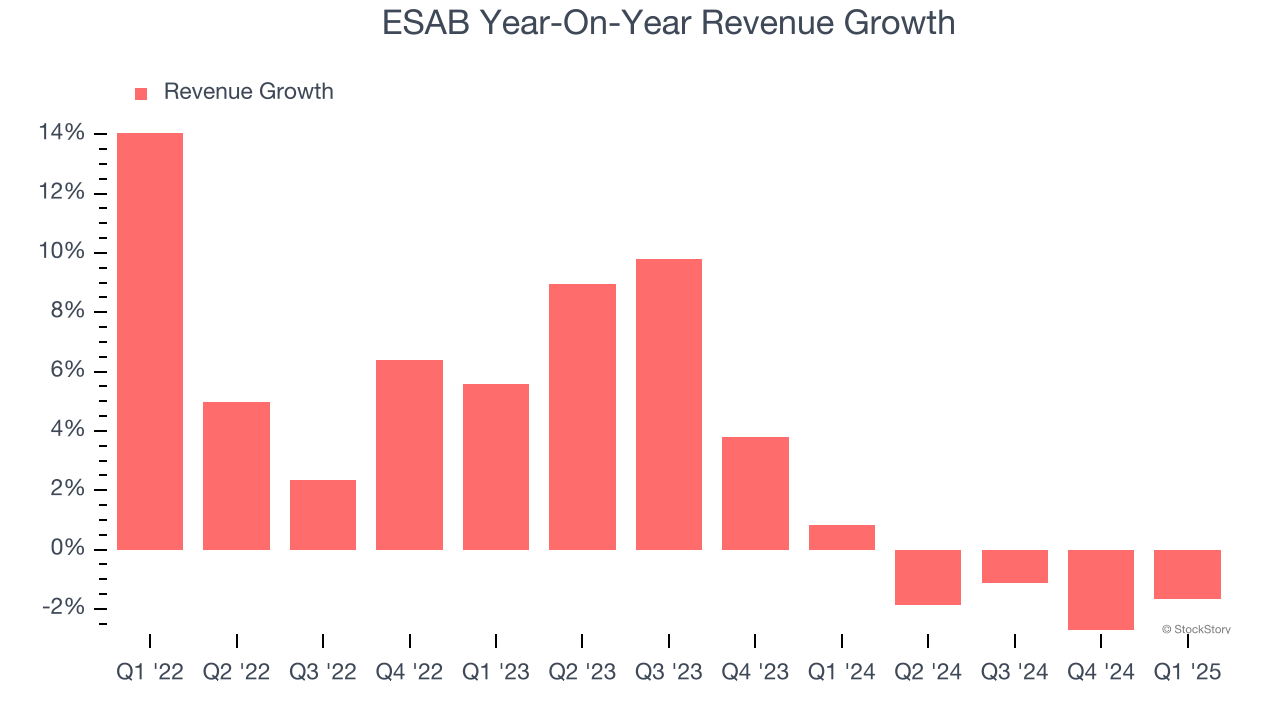
We can dig further into the company’s sales dynamics by analyzing its organic revenue, which strips out one-time events like acquisitions and currency fluctuations that don’t accurately reflect its fundamentals. Over the last two years, ESAB’s organic revenue averaged 2.8% year-on-year growth. Because this number aligns with its normal revenue growth, we can see the company’s core operations (not acquisitions and divestitures) drove most of its results. 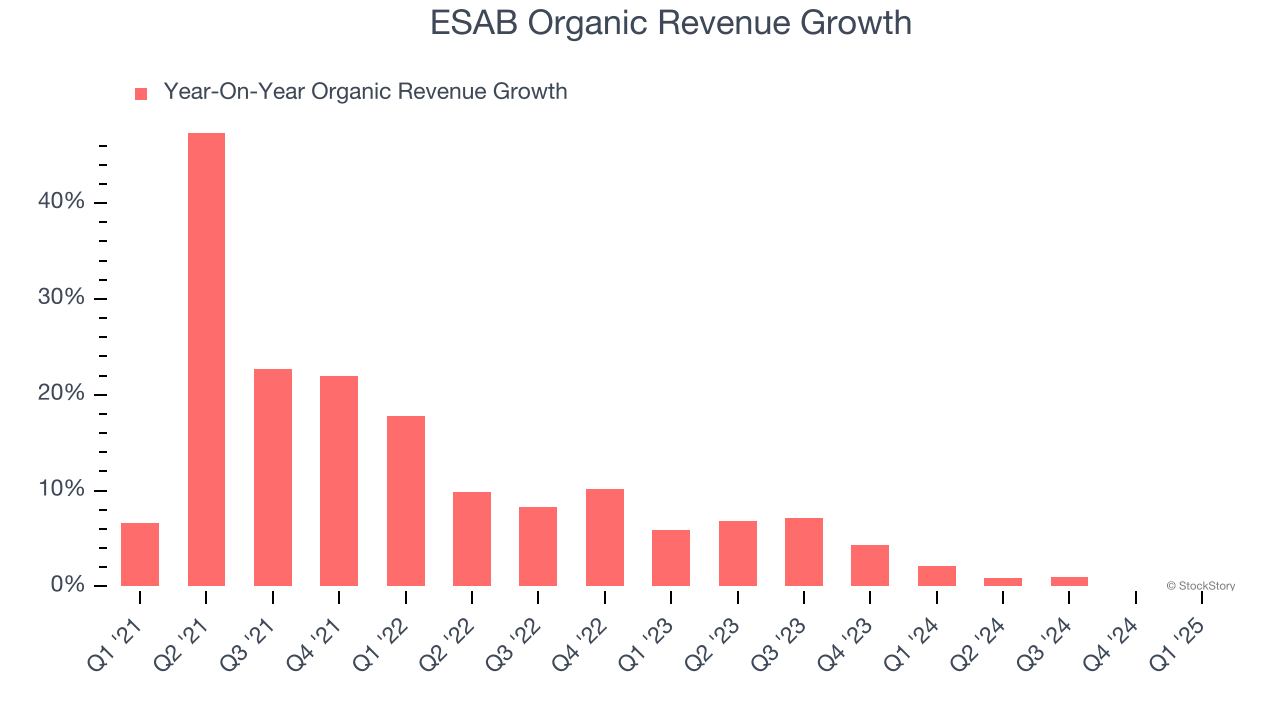
This quarter, ESAB’s revenue fell by 1.7% year on year to $678.1 million but beat Wall Street’s estimates by 2.2%.
Looking ahead, sell-side analysts expect revenue to grow 1.1% over the next 12 months, similar to its two-year rate. This projection doesn't excite us and suggests its newer products and services will not catalyze better top-line performance yet.
Software is eating the world and there is virtually no industry left that has been untouched by it. That drives increasing demand for tools helping software developers do their jobs, whether it be monitoring critical cloud infrastructure, integrating audio and video functionality, or ensuring smooth content streaming. Click here to access a free report on our 3 favorite stocks to play this generational megatrend.
Operating Margin
Operating margin is one of the best measures of profitability because it tells us how much money a company takes home after procuring and manufacturing its products, marketing and selling those products, and most importantly, keeping them relevant through research and development.
ESAB has been an efficient company over the last four years. It was one of the more profitable businesses in the industrials sector, boasting an average operating margin of 14.2%. This result isn’t too surprising as its gross margin gives it a favorable starting point.
Looking at the trend in its profitability, ESAB’s operating margin rose by 3.7 percentage points over the last four years, as its sales growth gave it operating leverage.
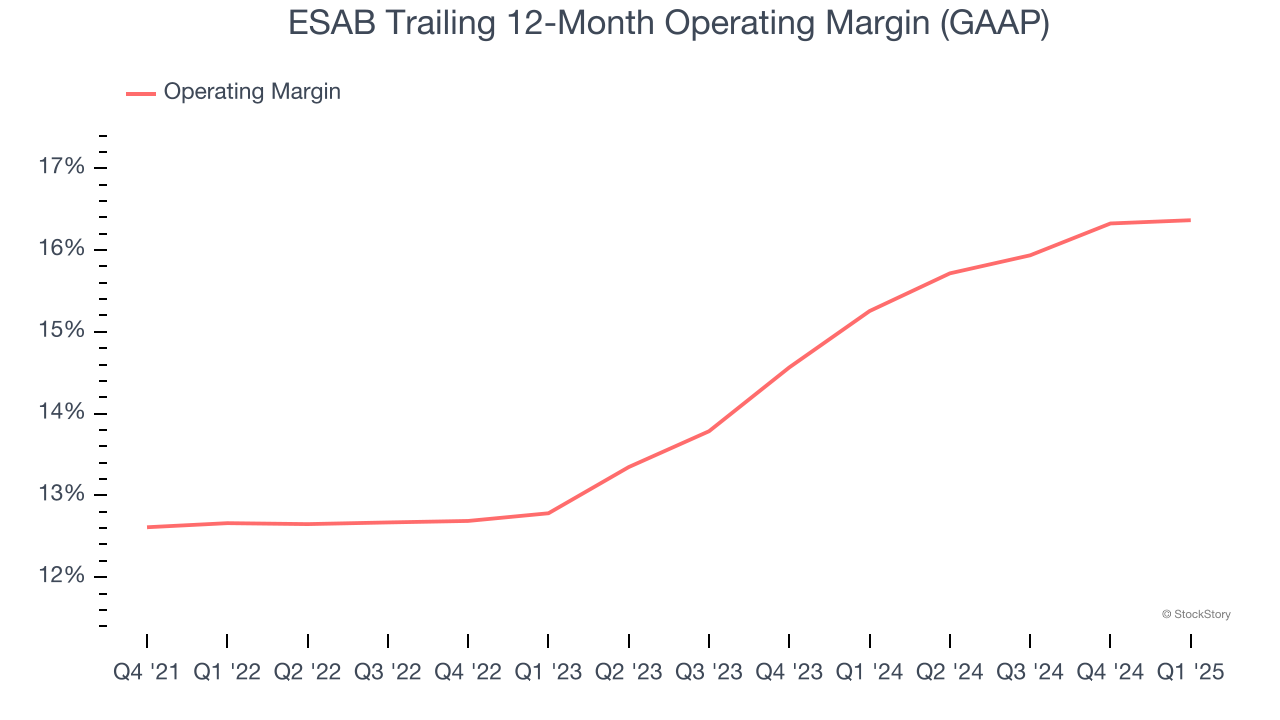
This quarter, ESAB generated an operating profit margin of 16.2%, in line with the same quarter last year. This indicates the company’s cost structure has recently been stable.
Earnings Per Share
Revenue trends explain a company’s historical growth, but the change in earnings per share (EPS) points to the profitability of that growth – for example, a company could inflate its sales through excessive spending on advertising and promotions.
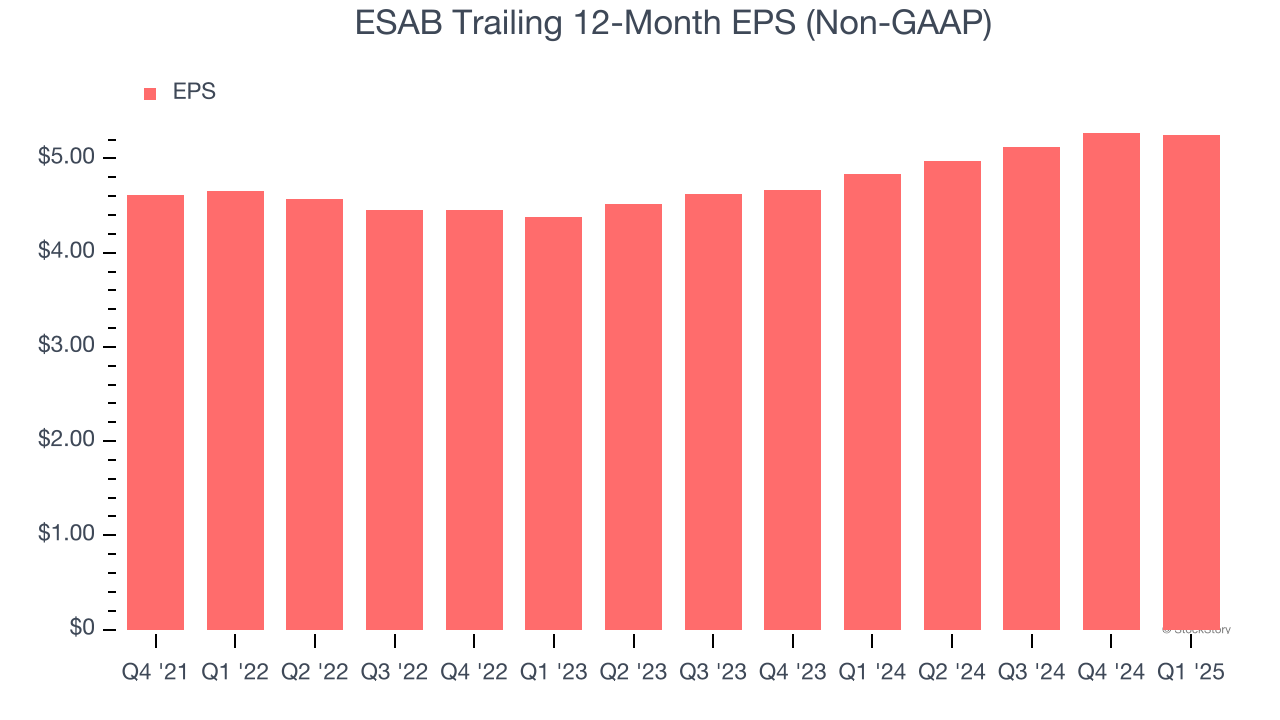
ESAB’s EPS grew at a decent 9.5% compounded annual growth rate over the last two years, higher than its 1.9% annualized revenue growth. This tells us the company became more profitable on a per-share basis as it expanded.
Diving into ESAB’s quality of earnings can give us a better understanding of its performance. While we mentioned earlier that ESAB’s operating margin was flat this quarter, a two-year view shows its margin has expanded by 2.9 percentage points. This was the most relevant factor (aside from the revenue impact) behind its higher earnings; taxes and interest expenses can also affect EPS but don’t tell us as much about a company’s fundamentals.
In Q1, ESAB reported EPS at $1.25, down from $1.27 in the same quarter last year. Despite falling year on year, this print beat analysts’ estimates by 3.6%. Over the next 12 months, Wall Street expects ESAB’s full-year EPS of $5.25 to grow 2.6%.
Key Takeaways from ESAB’s Q1 Results
We enjoyed seeing ESAB beat analysts’ EBITDA expectations this quarter. We were also glad its revenue outperformed Wall Street’s estimates. Overall, we think this was a solid quarter with some key areas of upside. The stock traded up 4.1% to $125.10 immediately following the results.
ESAB had an encouraging quarter, but one earnings result doesn’t necessarily make the stock a buy. Let’s see if this is a good investment. What happened in the latest quarter matters, but not as much as longer-term business quality and valuation, when deciding whether to invest in this stock. We cover that in our actionable full research report which you can read here, it’s free.