

Manufacturing company Stanley Black & Decker (NYSE:SWK) beat Wall Street’s revenue expectations in Q1 CY2025, but sales fell by 3.2% year on year to $3.74 billion. Its non-GAAP profit of $0.75 per share was 13.9% above analysts’ consensus estimates.
Is now the time to buy Stanley Black & Decker? Find out by accessing our full research report, it’s free.
Stanley Black & Decker (SWK) Q1 CY2025 Highlights:
- Revenue: $3.74 billion vs analyst estimates of $3.68 billion (3.2% year-on-year decline, 1.9% beat)
- Adjusted EPS: $0.75 vs analyst estimates of $0.66 (13.9% beat)
- Adjusted EBITDA: $361.8 million vs analyst estimates of $359.5 million (9.7% margin, 0.6% beat)
- Operating Margin: 5.5%, down from 6.6% in the same quarter last year
- Free Cash Flow was -$485 million compared to -$496.7 million in the same quarter last year
- Organic Revenue rose 1% year on year (-1.3% in the same quarter last year)
- Market Capitalization: $9.47 billion
Company Overview
With an iconic “STANLEY” logo which has remained virtually unchanged for over a century, Stanley Black & Decker (NYSE:SWK) is a manufacturer primarily catering to the tool and outdoor equipment industry.
Sales Growth
A company’s long-term sales performance is one signal of its overall quality. Even a bad business can shine for one or two quarters, but a top-tier one grows for years. Regrettably, Stanley Black & Decker’s sales grew at a sluggish 1.9% compounded annual growth rate over the last five years. This was below our standards and is a poor baseline for our analysis.
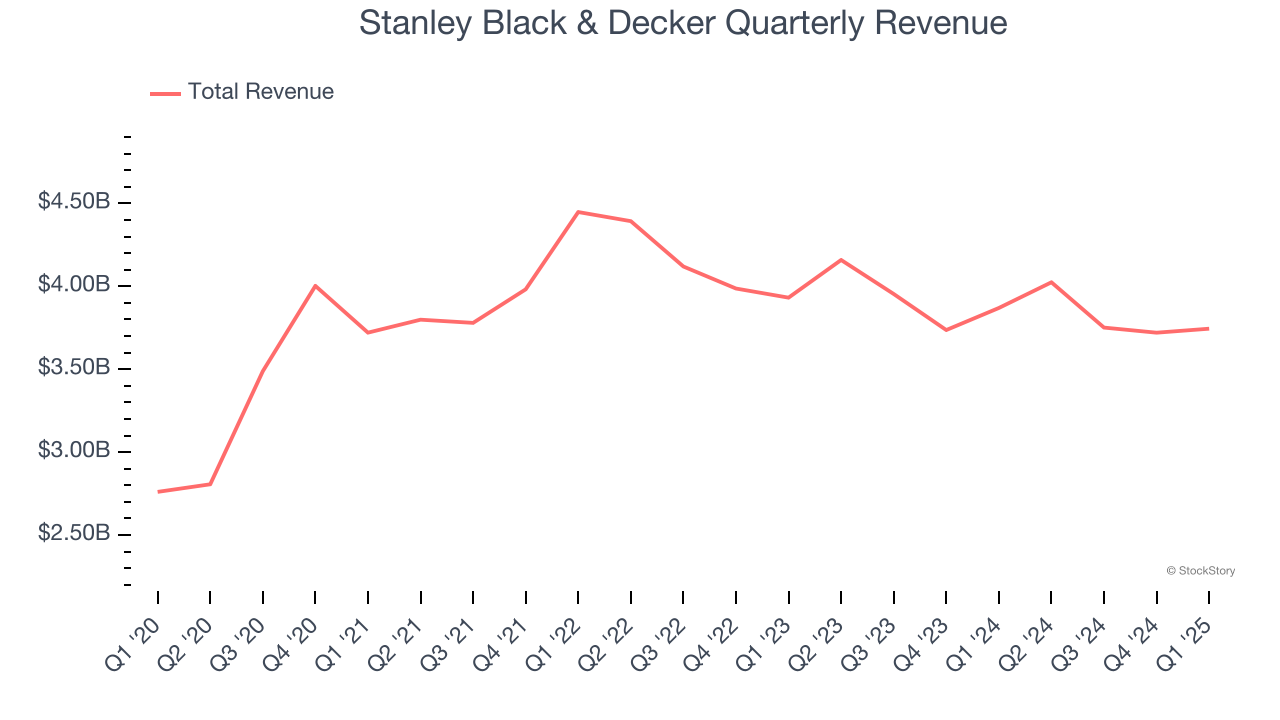
Long-term growth is the most important, but within industrials, a half-decade historical view may miss new industry trends or demand cycles. Stanley Black & Decker’s performance shows it grew in the past but relinquished its gains over the last two years, as its revenue fell by 3.7% annually. 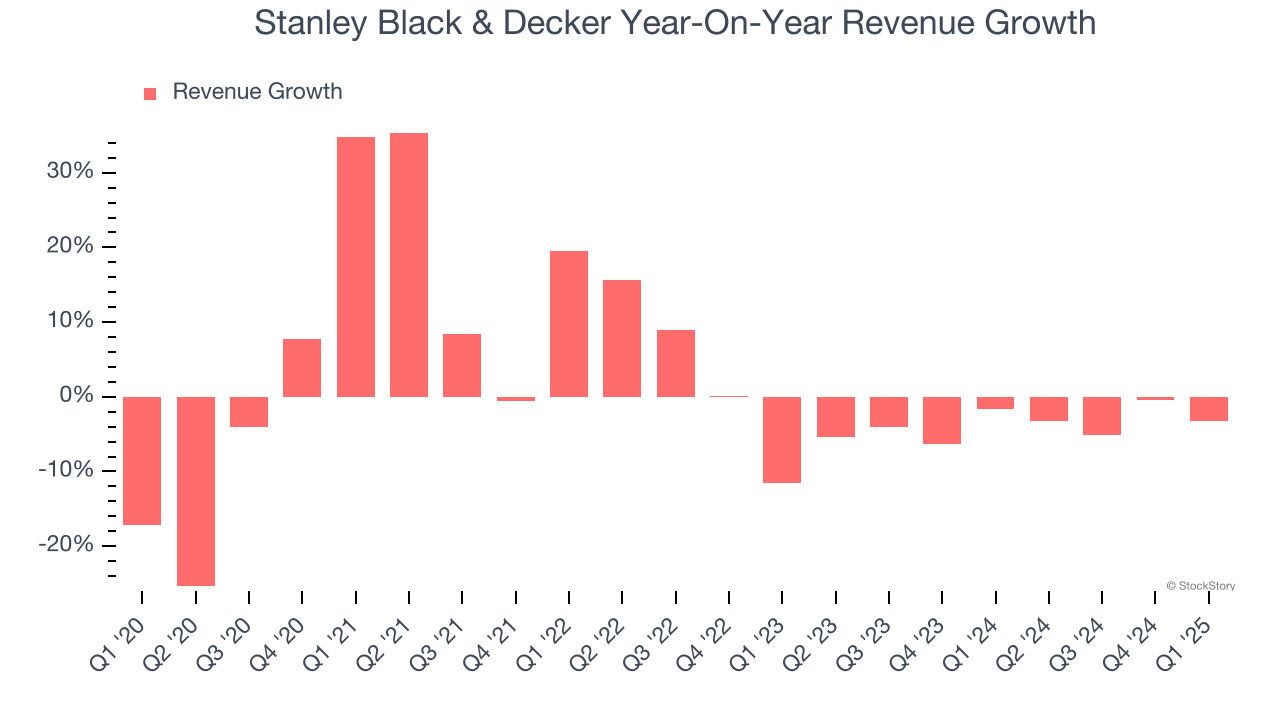
We can dig further into the company’s sales dynamics by analyzing its organic revenue, which strips out one-time events like acquisitions and currency fluctuations that don’t accurately reflect its fundamentals. Over the last two years, Stanley Black & Decker’s organic revenue averaged 1.8% year-on-year declines. Because this number is better than its normal revenue growth, we can see that some mixture of divestitures and foreign exchange rates dampened its headline results. 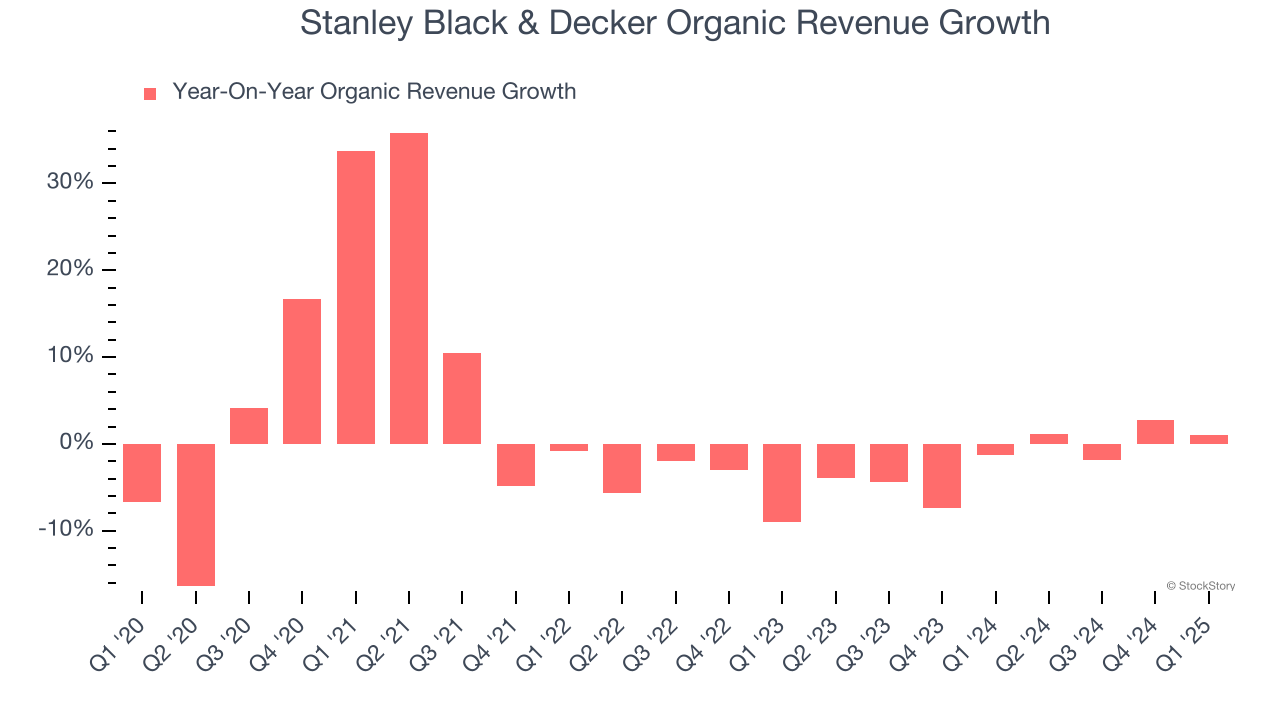
This quarter, Stanley Black & Decker’s revenue fell by 3.2% year on year to $3.74 billion but beat Wall Street’s estimates by 1.9%.
Looking ahead, sell-side analysts expect revenue to grow 1.4% over the next 12 months. While this projection suggests its newer products and services will catalyze better top-line performance, it is still below average for the sector.
Today’s young investors won’t have read the timeless lessons in Gorilla Game: Picking Winners In High Technology because it was written more than 20 years ago when Microsoft and Apple were first establishing their supremacy. But if we apply the same principles, then enterprise software stocks leveraging their own generative AI capabilities may well be the Gorillas of the future. So, in that spirit, we are excited to present our Special Free Report on a profitable, fast-growing enterprise software stock that is already riding the automation wave and looking to catch the generative AI next.
Operating Margin
Operating margin is one of the best measures of profitability because it tells us how much money a company takes home after procuring and manufacturing its products, marketing and selling those products, and most importantly, keeping them relevant through research and development.
Stanley Black & Decker has done a decent job managing its cost base over the last five years. The company has produced an average operating margin of 8.2%, higher than the broader industrials sector.
Analyzing the trend in its profitability, Stanley Black & Decker’s operating margin decreased by 8.2 percentage points over the last five years. This raises questions about the company’s expense base because its revenue growth should have given it leverage on its fixed costs, resulting in better economies of scale and profitability.
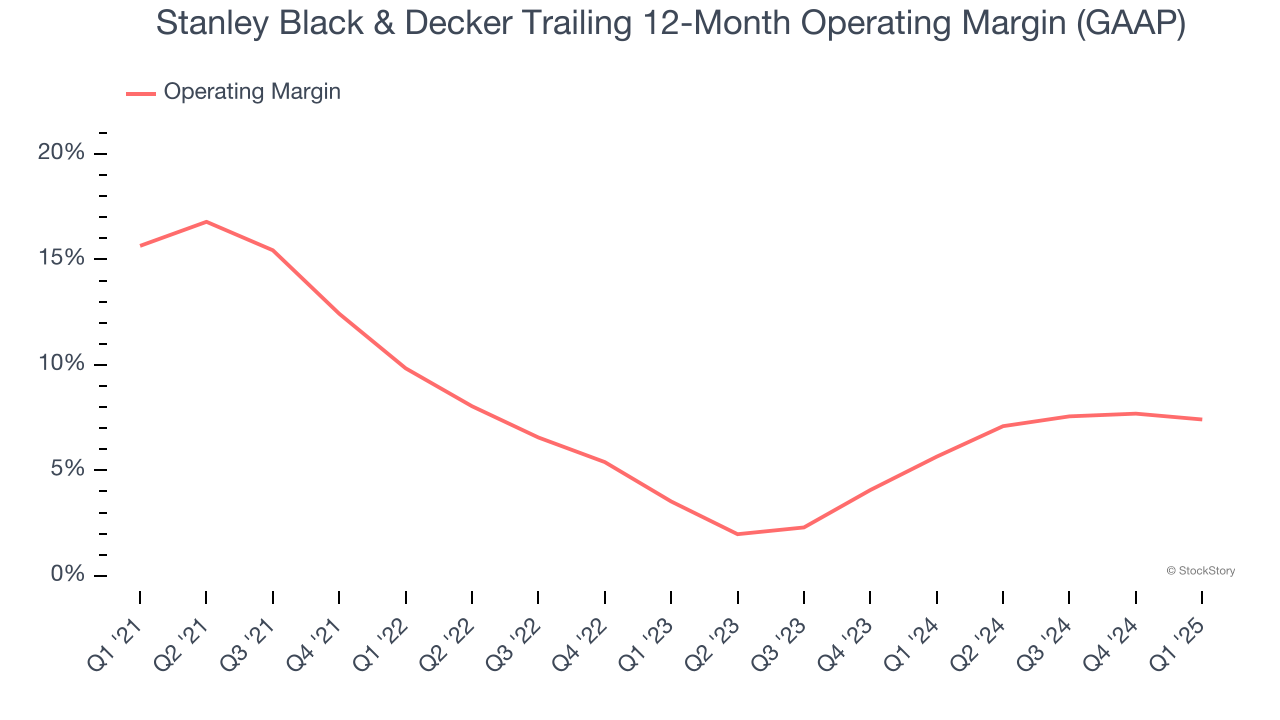
In Q1, Stanley Black & Decker generated an operating profit margin of 5.5%, down 1.2 percentage points year on year. Since Stanley Black & Decker’s operating margin decreased more than its gross margin, we can assume it was less efficient because expenses such as marketing, R&D, and administrative overhead increased.
Earnings Per Share
Revenue trends explain a company’s historical growth, but the long-term change in earnings per share (EPS) points to the profitability of that growth – for example, a company could inflate its sales through excessive spending on advertising and promotions.
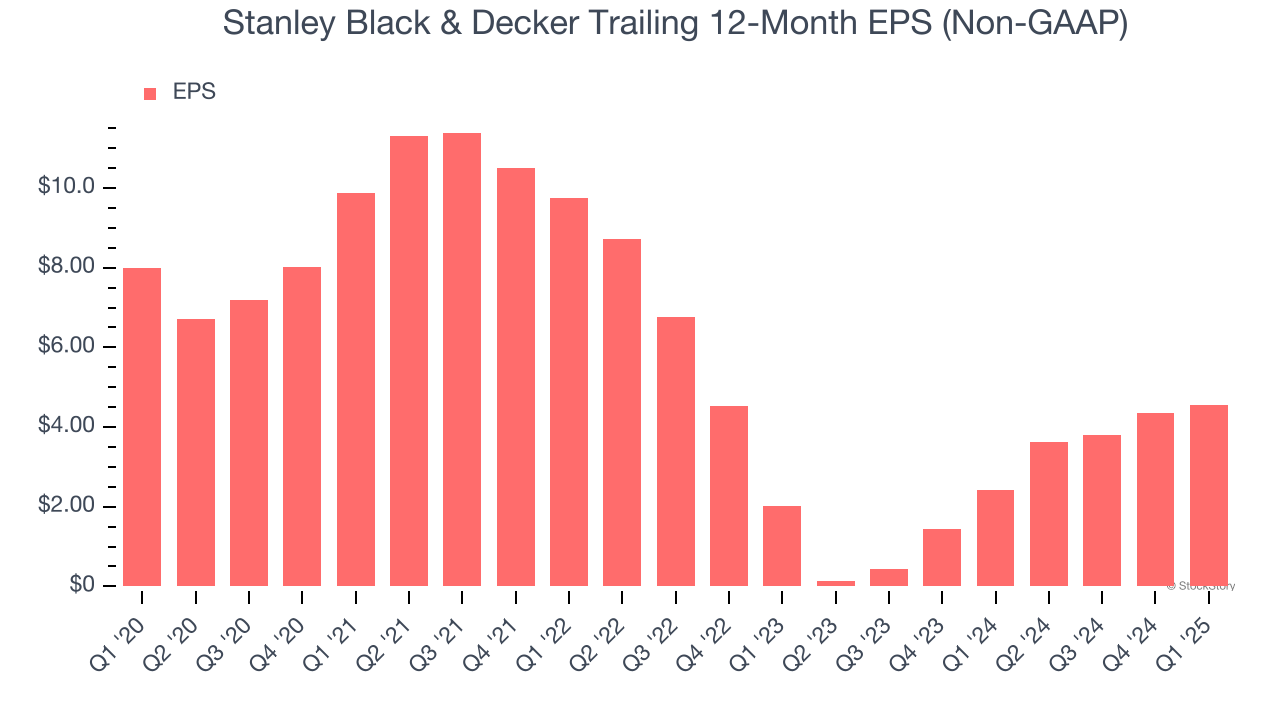
Sadly for Stanley Black & Decker, its EPS declined by 10.6% annually over the last five years while its revenue grew by 1.9%. This tells us the company became less profitable on a per-share basis as it expanded.
We can take a deeper look into Stanley Black & Decker’s earnings to better understand the drivers of its performance. As we mentioned earlier, Stanley Black & Decker’s operating margin declined by 8.2 percentage points over the last five years. This was the most relevant factor (aside from the revenue impact) behind its lower earnings; taxes and interest expenses can also affect EPS but don’t tell us as much about a company’s fundamentals.
Like with revenue, we analyze EPS over a more recent period because it can provide insight into an emerging theme or development for the business.
For Stanley Black & Decker, its two-year annual EPS growth of 49.9% was higher than its five-year trend. This acceleration made it one of the faster-growing industrials companies in recent history.
In Q1, Stanley Black & Decker reported EPS at $0.75, up from $0.56 in the same quarter last year. This print easily cleared analysts’ estimates, and shareholders should be content with the results. Over the next 12 months, Wall Street expects Stanley Black & Decker’s full-year EPS of $4.55 to grow 17.6%.
Key Takeaways from Stanley Black & Decker’s Q1 Results
We enjoyed seeing Stanley Black & Decker beat analysts’ EPS expectations this quarter. We were also glad its revenue outperformed Wall Street’s estimates. Overall, we think this was a decent quarter with some key metrics above expectations. Still, shares traded down 1.5% to $60.25 immediately following the results.
Is Stanley Black & Decker an attractive investment opportunity right now? We think that the latest quarter is only one piece of the longer-term business quality puzzle. Quality, when combined with valuation, can help determine if the stock is a buy. We cover that in our actionable full research report which you can read here, it’s free.